|
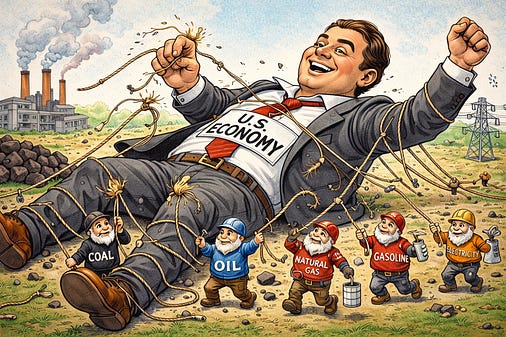 |
Today kicks off a three-part series here at THB focused on the energy intensity of the U.S. economy. Energy intensity is a key factor of the Kaya Identity and one of the only levers available to accelerate the decarbonization of the economy.¹ One of the key takeaways from the data reviewed in this series is that the U.S. economy has been decarbonizing for more than a half-century, independent of efforts to accelerate the rate of decarbonization.
The series takes a detailed look at changes in energy intensity in the U.S. economy focusing on motor gasoline, natural gas, coal, electricity, nuclear, hydro, wind, and solar — which together account for essentially all energy consumption and direct energy expenditure.
Today, in Part One, I take a look at fossil fuels. Specifically, gasoline, natural gas, and coal. I also take a look at electricity. Part Two looks at solar, wind, nuclear, and hydro power. Part Three looks at the broader lessons of the analysis, including what energy intensity might tell us about the geography of U.S. politics.
Along the way there will be some surprising findings — at least there have been for me!
The series is organized across three posts, which I’ll publish starting today and over the next week or so. Each post is organized around four top-line claims, so twelve in all. At the bottom of Part Three I’ll post an Excel file with all data from the figures in the series and links to original sources. Paid subscribers will be provided a Powerpoint file with all the figures.
Let’s get to it . . .
1. Physical energy intensity has fallen dramatically across every fossil fuel since 1970
Throughout this series I’ll employ two different measures of energy intensity, each telling a unique story. Physical energy intensity refers to fuel volume or electrical generation in physical units (e.g., barrels, cubic feet, short tons, kilowatt-hours, etc.) per billion dollars of real GDP. Energy expenditure intensity is the real consumer (or utility) expenditure on a given energy source expressed as a percent of real GDP — It is a measure of the direct economic weight of energy on the economy.
These metrics tell different, but related, stories.
Physical energy intensity has declined substantially since peaking the early 1970s for every fossil and for electricty:
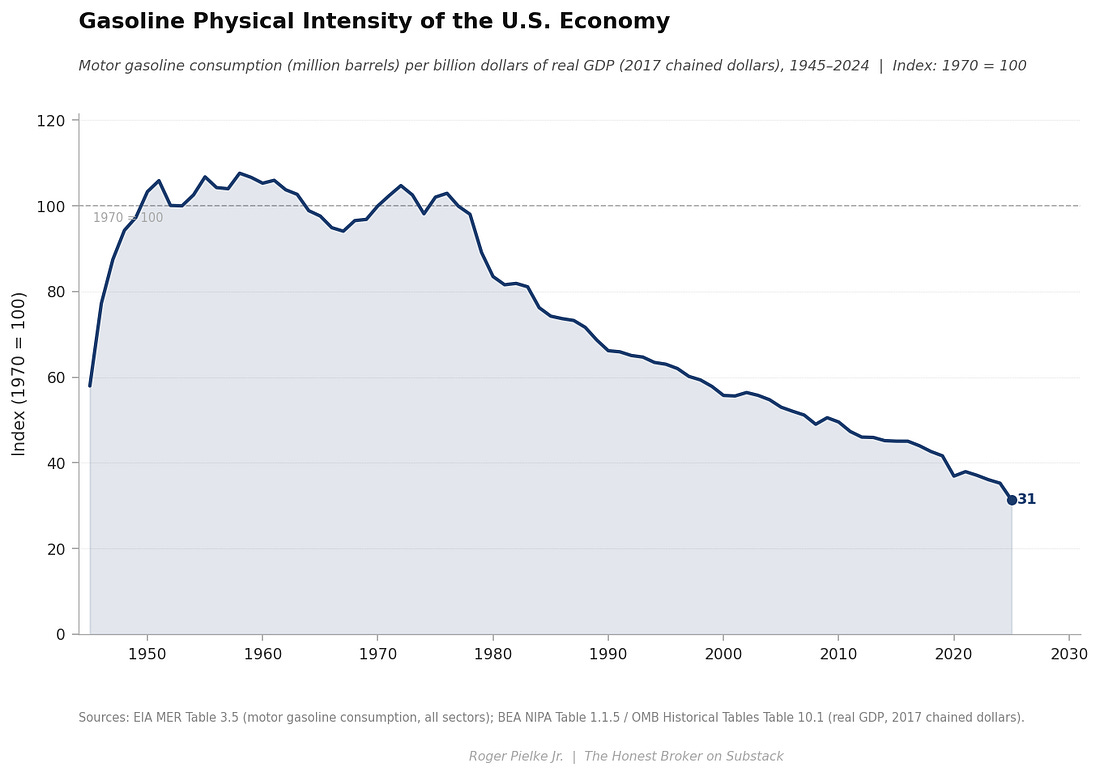
Motor gasoline: ~70%²
Natural gas: ~64%
Coal: ~84%
Retail electricity: ~39%
The figure below shows that gasoline physical intensity was fairly constant from about 1950 into the 1970s and has plummeted since — dropping by about 70%.
The ~1950s to 1970s plateau is explained by the expansion of the U.S. automobile and trucking economy. Gas was cheap, cars were becoming more powerful, and there were few incentives for improving fuel economy. The 1970s energy crises changed all that — Geopolitics, technology, and policy combined to usher in the modern era of steadily declining gasoline physical intensity.
More precisely, prior to the 1970s, vehicle miles traveled increased proportionately to GDP growth, and fuel economy per mile traveled remained constant. After that, miles traveled increased slower than GDP and fuel economy improved dramatically — from ~13 miles per gallon in the early 1970s to about ~27 miles per gallon in 1990.
 |
The next figure below, natural gas physical intensity of the U.S. economy, shows a dramatic increase from ~1950 into the 1970s, followed by a sharp decline into the 1980s followed by a slower decline and plateau after the 2010s.
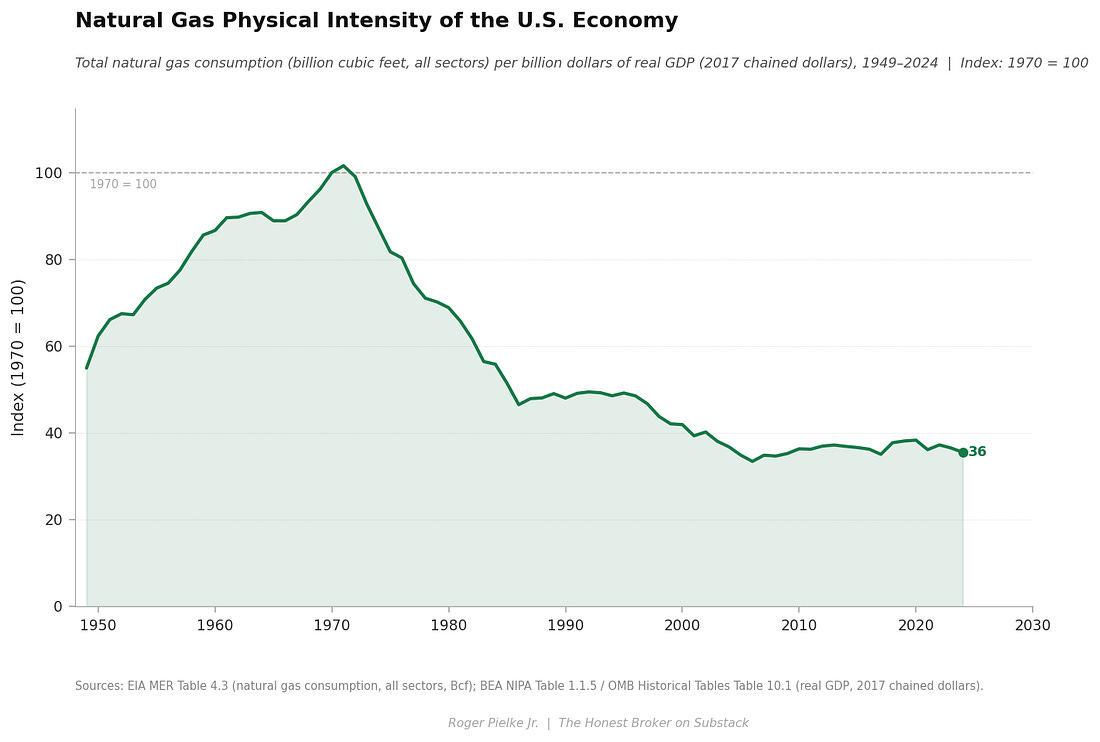 |
For natural gas in the U.S. economy, the 1950s to the 1970s saw the build-out of the interstate pipeline system and the rapid displacement of coal in buildings and industry, resulting in gas consumption growing much faster than GDP, pushing intensity sharply upward. The reversal in the 1970s and early 1980s was in large part driven by policies, including price controls that produced supply shortages. At this time the view of energy experts and the federal government was that the nation was going to soon run out of natural gas, prompting policies that promoted reducing reliance on gas.
After deregulation and the advent of highly efficient combined-cycle gas power plants, gas consumption recovered, but within a more efficient U.S. economy. The shale revolution following the early 2000s motivated coal-to-gas switching in electricity, at the same time that overall electricity demand was flat, resulting in the recent plateau in natural gas physical intensity — but that era may now be over.
The next figure, below, shows coal physical intensity of the U.S. economy. The story here is one of inexorable decline. Coal is a footnote in the U.S. energy economy, which we will return to below.
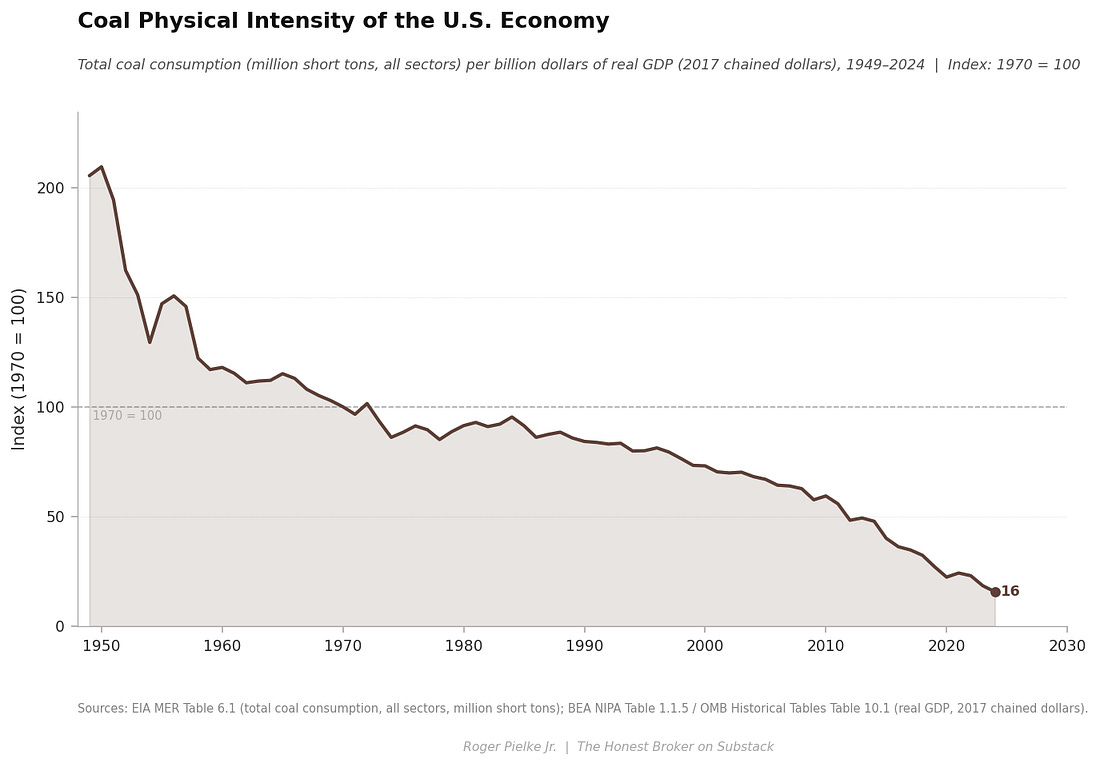 |
The dominant drivers of the long-term decline in the physical energy intensity of fossil fuels were the price shocks of the 1970s, policy making in response, technological change, and the long-run structural shift of the U.S. economy away from energy-intensive manufacturing and toward energy-light services and information.
2. The U.S. energy economy transformed in the 1970s, a process that is still underway today
As shown above, every physical and expenditure intensity series for fossil fuels shows the same inflection points in the 1970s. These inflection points represent a true energy transition point, from economic growth powered by increasing physical intensity of fossil fuels to an economy that decoupled, with economic growth accompanied by decreasing physical intensity of fossil fuels.
Fossil fuel expenditure intensity — direct expenditures on these sources as a proportion of the economy — tells a related, but more complex story.
Trends in the physical intensity of fossil fuels appear comparatively simple because they are shaped by slow-moving, largely one-directional forces such as improvements in the efficiency of using fuels, changes in the technologies of energy consumption (think cars, computers, light bulbs), energy policies that typically impose changes over longer terms (like CAFE standards, power plant emissions regulations), and the relatively slow growth of U.S. energy consumption of recent decades.
Expenditure intensity, in contrast, results from volatile prices resulting from factors related to the global markets for supply — such as oil shocks due to geopolitical conflict and the short-term rise and fall of commodity prices. The result is that the underlying physical relationship between energy use and economic output evolves more smoothly over time, while the economic burden of energy rises and falls in discrete episodes linked to the broader global economy.
In the figure below, you can see that gasoline expenditure intensity peaked at 5.1% of GDP in 1980 — meaning that about $1 out of every $20 of spending in the overall U.S. economy went to paying for gasoline. By 2024 had fallen to ~1.5%, a 70% decline in the economic burden of gasoline spending.³
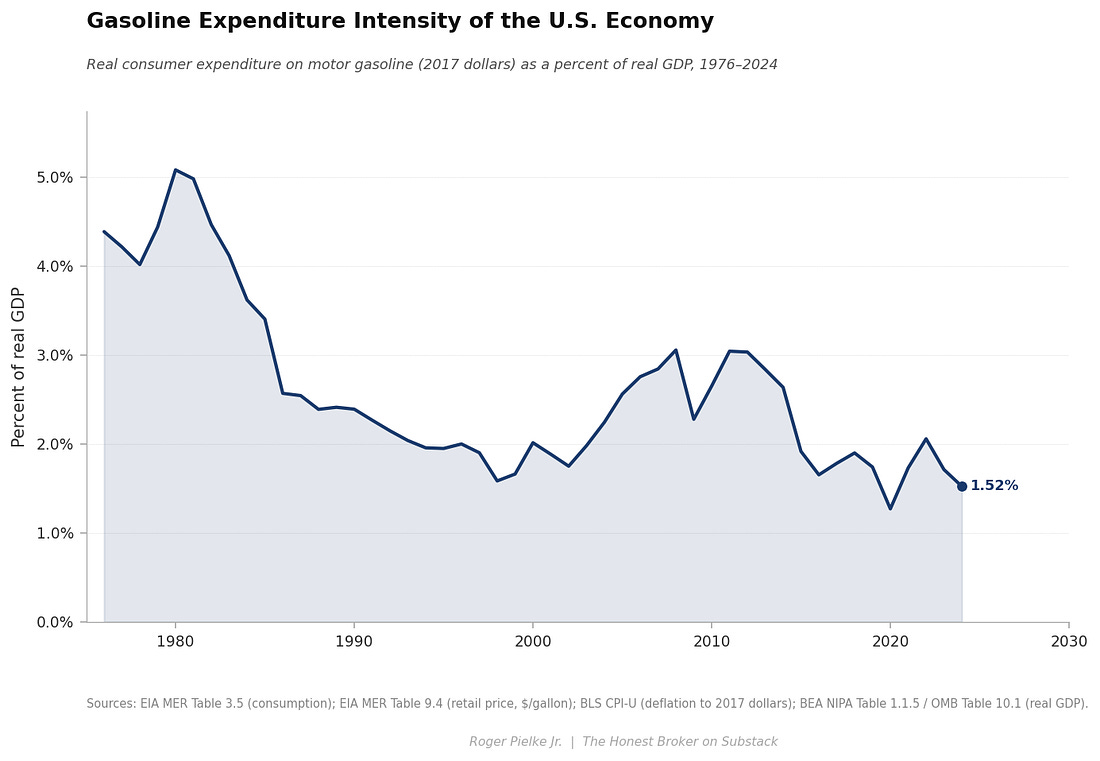 |
Even though the past decade has seen a historically low share of gasoline spending in the overall U.S. economy, the post-COVID increase — from ~1.3% to ~2.0% — became politically salient, a topic I’ll return to in detail in Part Three.
3. Coal’s expenditure intensity is now essentially zero, far out of proportion with its perceived political significance
Coal expenditure intensity peaked at ~1.1% of GDP in 1949, when it was the dominant fuel in the U.S. economy and then approached this peak again in the early 1980s. By 2024 it had fallen to ~0.1% — about one-tenth of one percent of GDP.
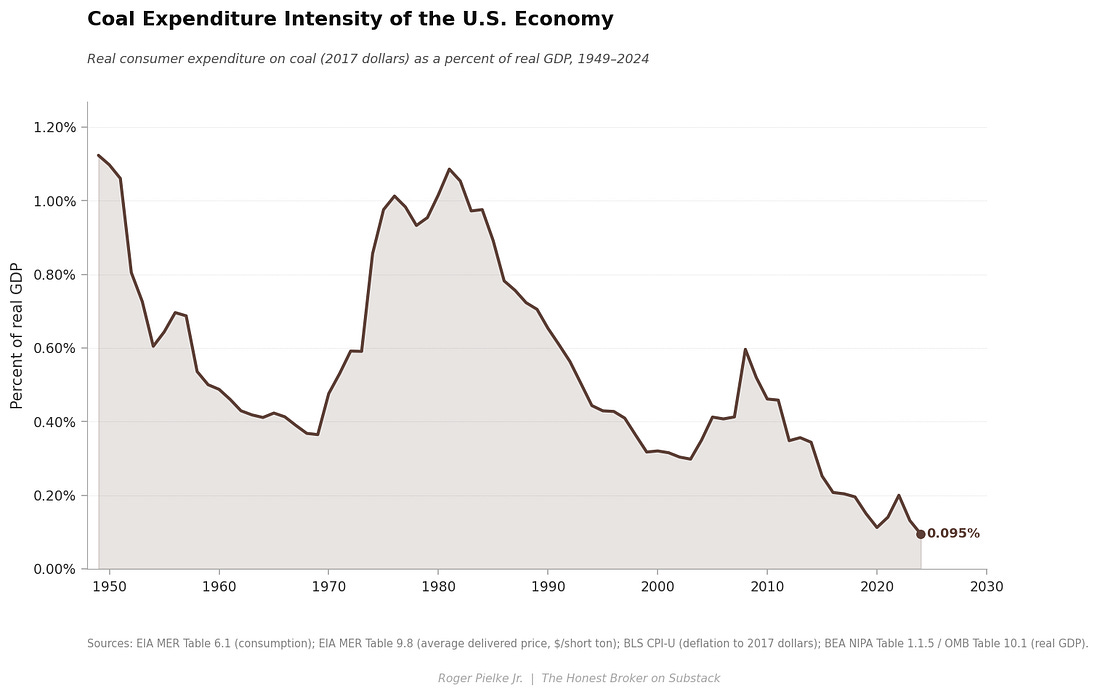 |
Coal’s expenditure intensity peak in 1949 might be considered the inflection point between the industrial revolution and the modernization of the second half of the twentieth century. Throughout the first half of the last century, coal was the primary fuel for railroads, heated buildings, and industry. The rapid decline that followed reflects the postwar displacement of coal by oil and natural gas across the economy.
The second coal expenditure peak in the early 1980s occurred for different reasons: a build-out of coal-plant construction coinciding with the economy-wide energy price shocks of the 1970s, which raised mining, transport, and capital costs. It seems ancient history now, but in 1978 Congress passed the Powerplant and Industrial Fuel Act of 1978 which mandated that coal serve as the primary fuel for all new power plant construction, partly motivated by concerns that natural gas supplies would run dry and petroleum was geopoltically risky.
The long decline in coal expenditure intensity after the mid-1980s was driven by a collapse in coal costs as the highly productive surface mining in Wyoming’s Powder River Basin combined with rail deregulation — which lowered the costs of transporting low-sulfur coal from Wyoming to the east coast — and higher rates of power-plant utilization. The brief resurgence around 2008 reflects a surge in global coal prices — driven by China’s rapid expansion of coal consumption. The sharp drop thereafter that marks the shale-gas transition, which made natural gas cheaper than coal, thereby reducing both demand for coal and its price.
As a component of the U.S. economy, coal now represents little more than a rounding error. Coal’s political salience vastly exceeds its economic weight. Policy makers should take note.
4. Electricity physical intensity has declined far less than fossil fuels, a result of the increasing electricification of the economy
Every fossil fuel has seen physical intensity declines of 64–84% since 1970. In contrast, retail electricity physical intensity has fallen only ~39% over the same period, shown in the figure below.
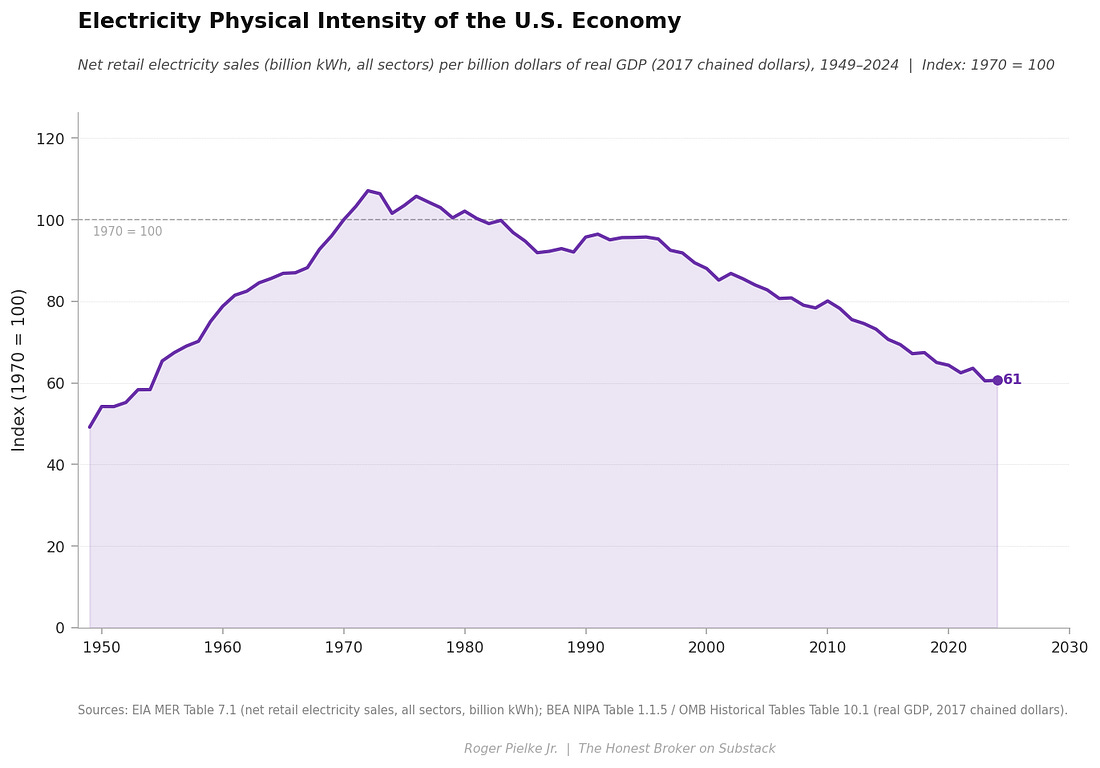 |
The slower decline in electricity’s physical intensity than for fossil fuels reflects the increasing electrification of the economy, meaning the systematic substitution of electricity for direct fuel combustion across industry, space heating, computing, and manufacturing. Electricity efficiency gains are real, but they are offset by an economy that keeps finding new uses for electricity even as consumption per unit of output becomes more efficient.
The figure below shows retail electricity expenditure intensity figure along with the natural gas expenditure intensity. The supply mix for electricity goes beyond gas to include nuclear, wind, solar, and hydro, which will be covered in Part Two.
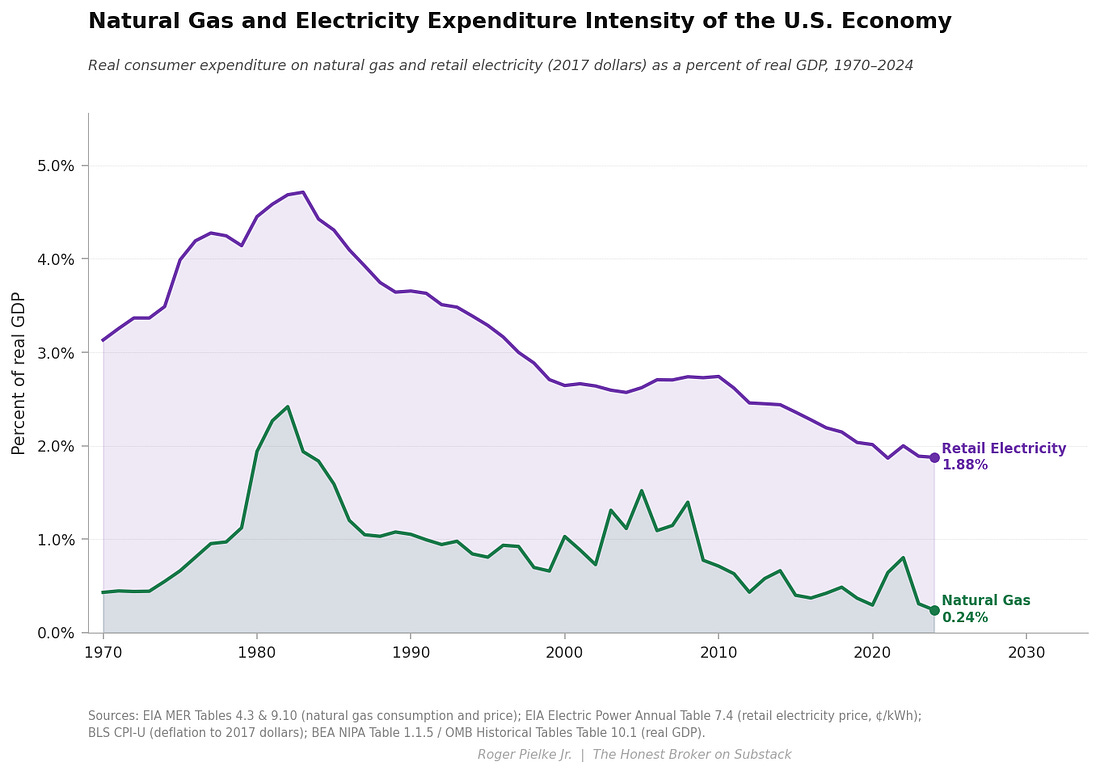 |
Electricity expenditure intensity peaks in the early 1980s as utilities were recovering the cost of power plants built during the 1970s, when coal and nuclear plants experienced large construction overruns and were financed at very high interest rates. These capital costs were passed directly into retail rates paid by consumers. The long decline that followed reflects the amortization of that capital stock, sharply higher capacity factors at coal and nuclear plants, falling real fuel costs, and steady reductions in the amount of electricity required per unit of economic output due to efficiency and structural change. After 2008, cheap natural gas resulting from the shale gas revolution further reduced wholesale power prices. The result is that even as the economy continued to electrify, as a share of GDP, electricity expenditures fell dramatically — 2024 was a historic low point.
If, as widely expected, AI data centers and electric vehicles increase electricity demand, then the long-term decline in electricity’s physical and expenditure intensity may plateau or even reverse.
Stay tuned for Part Two, which covers nuclear, hydro, wind, and solar and what the physical and expenditure data say about the low-carbon transition.
Comments, critique, discussion — All welcome!
Before you go — If you learned something today, let me know by clicking that “❤️ Like”. More likes mean that THB rises in the Substack algorithm and gets in front of more readers. Thanks!
Upping my game: Things might look a bit different here at THB — I am exploring AI for quantitative research. You’ll see improved figures, deeper quantitative analyses, and shared data and code for replication or further exploration. See How I use AI for more details. Let me know what you think!
Posts like this one here at THB exist only because of your support. Please consider sharing, subscribing, or upgrading to a paid subscription. Paid subscribers know that they are supporting independent analyses and writing found nowhere else — They also have access to THB Pro, with PDFs of some of my books and paywalled THB posts. Thank you!
I will add this three-part series to the ongoing THB series on understanding decarbonization. You can find Part One of that series below.
 |
|
Motor gasoline makes up about 45% of the volume of a barrel of oil.
I’ve long had an interest in energy edpenditure intensity of the economy. Here from 2012 is an early post on gasoline expenditure intensity of the U.S. economy, showing a decline well underway back then.
You're currently a free subscriber to The Honest Broker. For the full experience, upgrade your subscription.
![]()
![]()