|
 |
As we watch the “Flu” fear campaign develop (“Britain could be heading for the worst “flu” season on record”), we are watching the facts. Facts sometimes are confusing. Especially when they get in the way of what is beginning to look like the elaborate construction of yet another deadcat.
As an aside, the expression deadcat reminds Tommy of when he was very little: a family photographer would look at him and say, “guarda l’uccellino,” “watch the birdie,” and take a shot of a transfixed Tommy watching the uccellino.
So let’s explain the facts:
Have a look at the UK Scare Agency Emergency Department Bulletin: 9 November 2025, week 45.
It’s 34 pages, but we are so kind to our beloved readers, we provide the main point.
Go to page 9 and you will see:
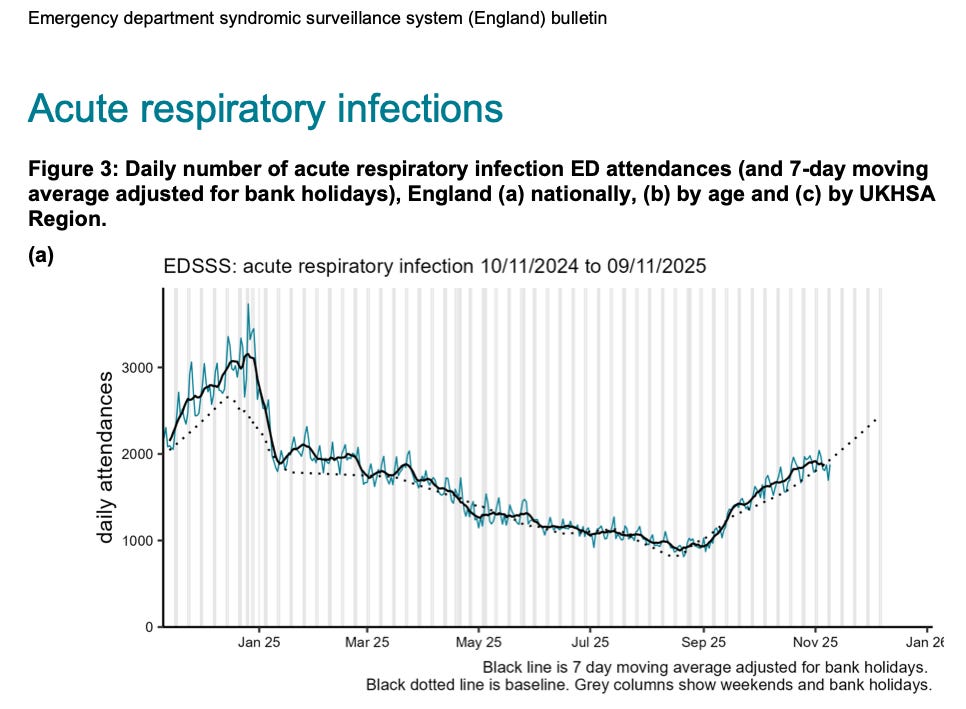 |
So these are ILI attendance at Emergency Departments (ED) in England for all ages in the periods specified. It shows a typical seasonal pattern, and remember these are F words, not influenza, rhino or whatever. ILI —the f-word —remember: this is syndromic surveillance. Same signs and symptoms, multi-agent.
 |
|
Next, how many major EDs are there in England? A difficult one that even Matt finds challenging to answer. There are 191 acute medical units in England, which include major emergency departments. These 191 units operate within 131 different trusts. There are 122 NHS trusts that operate major emergency departments (Type 1 departments) that account for the majority of attendances and are operated by 122 NHS trusts.
So, let’s round it up to 200 as an educated guesstimate.
Now go get a degree in rocket science, then come back and do this: 2000 attendances per 200 EDs per day. Giving 10 attendances for ILI (of unknown severity) a day (At 122 EDs, it’s 16 a day). Hardly overwhelmed.
Sir Jim Mackey said he expected hospitals to be “at capacity” this winter. It doesn’t look like it, guv.
In fact, “at capacity” of what? We ask ourselves.
Last point: ignore the grey dots, look at the hard line. Is it now beginning to look like Farr’s law in action?
Has ILI peaked? All will be revealed. The theory is that it’s the youngsters who drive what happened next.
Now let’s look at the same data. We think it’s the same data because it doesn’t add to the big picture, but let’s ignore the trifle. This time by age group:
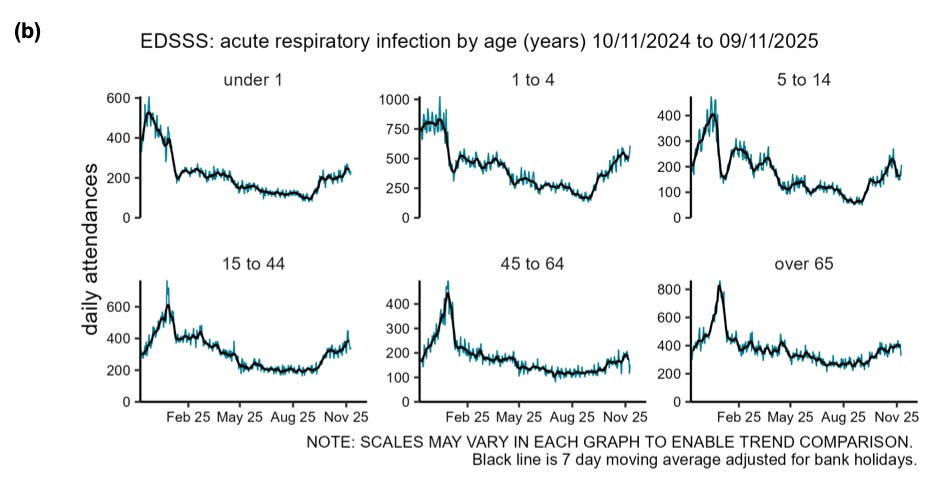 |
400 old geezers and geezeresses a day in EDs all over England. Another degree, this time in quantum physics, and later we get 400/200, that is 2 a day on average.
The latest “flu” and COVID-19 surveillance report is also something you won’t read about in the media, as it also doesn’t support the Mackey narrative.
Overall, the weekly hospital admission rate for influenza hospitalisations was stable at 3.85 per 100,000, compared with 3.96 per 100,000 in the previous week. Hmm isn’t that going down?
Influenza positivity in week 45 increased slightly, with a weekly average positivity rate of 11.9% compared with 10.9% in the previous week. Influenza positivity rates were highest among those aged 5-14 years, with a weekly average of 28%, but have notably decreased from 37%.
 |
To add to the confusion of what is happening with ARIs, it depends on where you look. Data from the RCGP Research and Surveillance Centre RSC.
Rates of influenza-like illness (ILI) remain above the seasonal average for this time of year and continue to climb, in contrast to the UKHSA’s report, which shows a decline. However, work this one out: Rates of acute respiratory illness (ARI) have plateaued and nationally remain below the seasonal average, page
The above seasonal average equates to an additional 2 cases per 100,000 population at this time of year compared to the five-year average.
 |
So, if GPs and EDs aren’t overwhelmed, who is?
It seems no one has a clue. However, one thing they are acutely aware of is the lack of beds, as the benchmark of around 90% (or 92% max), often flagged as a safe operational level for bed occupancy
Yet, for October, current NHS data shows that 92,881 General and adult beds are occupied, with a 93.6% occupancy rate, and that the number of adult escalation beds available for winter is 1,915.
The adult population of England is roughly 43.4 million people aged 18 and over. So, that’s about 1 extra escalation bed per 22,663 adults—that should do it.
The data is so confusing that we wonder if anyone has any oversight. Worryingly, the UKHSA tells us there are problems with the data, meaning comparisons with previous years may be meaningless.
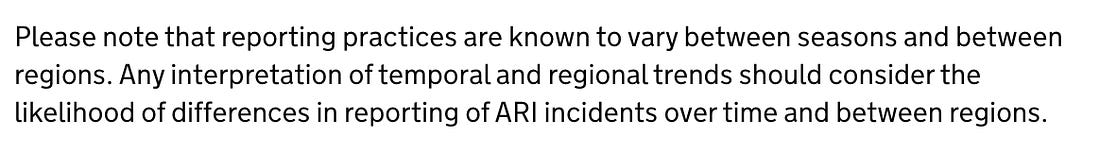 |
We are left wondering whether the “winter crisis” is an artefact to cover up the systemic problems in the NHS. The current reporting systems are muddled, and analysts should exercise extreme caution when comparing infectious-disease surveillance data across calendar years.
This post was written by two old geezers who are not looking at the Uccellino and have to work hard to decipher the stats coming out of government.
You're currently a free subscriber to Trust the Evidence. For the full experience, upgrade your subscription.
![]()
![]()