|
 |
One of the challenges, even for experts, in making sense of climate projections is that the scenarios underlying the projections are so complex as to be impenetrable without a lot of effort and expertise. Opaque assumptions make interpreting climate projections fraught with challenges and consequently, they are easily misinterpreted and misused.
Today, I try to make climate scenarios more understandable, with a specific focus on the energy mix assumed in climate scenarios. As you’ll see, the assumed energy mix in scenarios is a key factor in projections of changes in global temperatures to 2100.
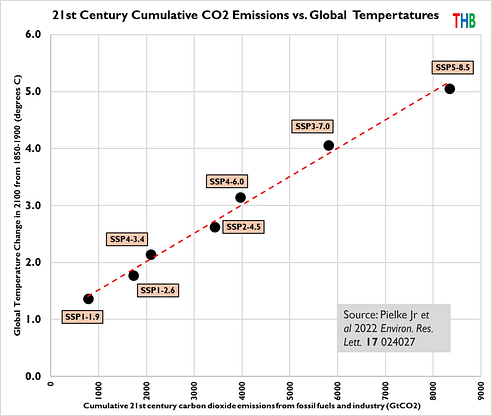
Let’s start with the very close relationship of cumulative carbon dioxide emissions and projected global temperature change by 2100, as shown in the figure below. The greater the cumulative emissions, the higher the global temperature.¹
 |
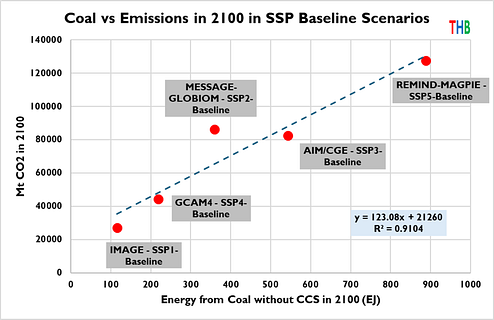
The next figure shows the relationship of unmitigated coal consumptionin 2100 with carbon dioxide emissions from fossil fuel and industry, also in 2100. Although there are other sources of carbon dioxide emissions, if all you know is what the scenarios assume for unmitigated coal consumption, the figure shows that you can readily estimate total emissions.
 |
Underneath the complexity of climate scenarios there is some simplicity — scenarios assume a tight relationship of coal consumption to overall carbon dioxide emissions and also a tight relationship of carbon dioxide emissions to projected global temperature change in 2100.
That means that assumptions about changes to the global energy mix from today to 2100 are crucial for understanding the magnitude of projected changes in climate.
Let’s next look at the global energy consumption mix for 2023 among oil, natural gas, coal, and carbon-free sources (defined here as wind, solar, nuclear and hydro). In 2023, the country that best approximates the global mix is Turkey.
Both are shown in the figure below.
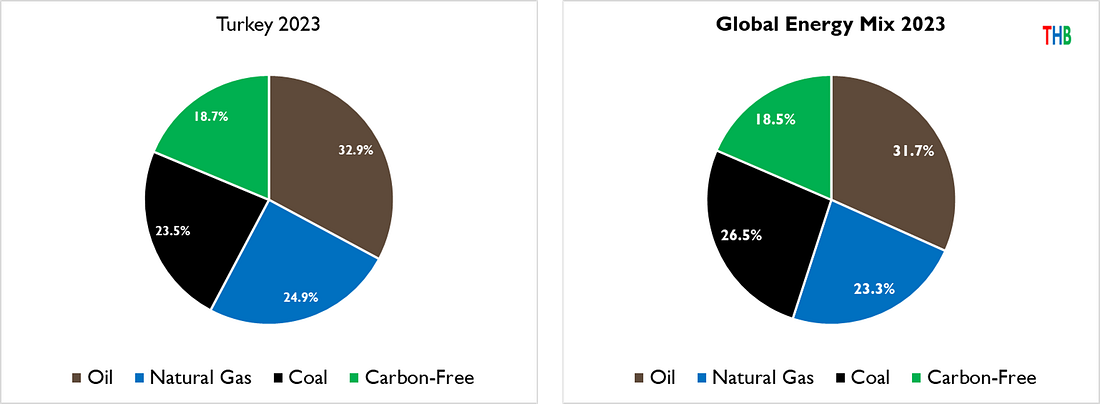
In 2023, global per capita carbon dioxide emissions were ~4.4 tons and Turkey’s were ~4.7 tons.² Thus, Turkey offers an excellent country-sized analogue for understanding the global energy mix.
We can next ask, what countries’ energy mix in 2023 best approximate the energy mixes assumed in the most commonly used climate scenarios for 2100? I enlisted ChatGPT and Claude to assist in the analyses presented below.³
Let’s start with SSP3-7.0, which Part 1 of this series discussed in detail. SSP3-7.0 is incorrectly characterized as a “current policy” scenario by the IPCC AR6 and is also the basis for the high-end scenario in the forthcoming set of new climate scenarios. Climate science is too important for this sort of sloppiness, but I digress.
China is the country in 2023 with an energy mix most like SSP3-7.0 in 2100.
The distinctive feature of China’s energy mix is coal, which in 2023 comprised a majority of China’s total energy consumption. Under SSP3-7.0, global coal consumption (unmitigated) triples in absolute terms and also doubles as a proportion of the global energy mix.
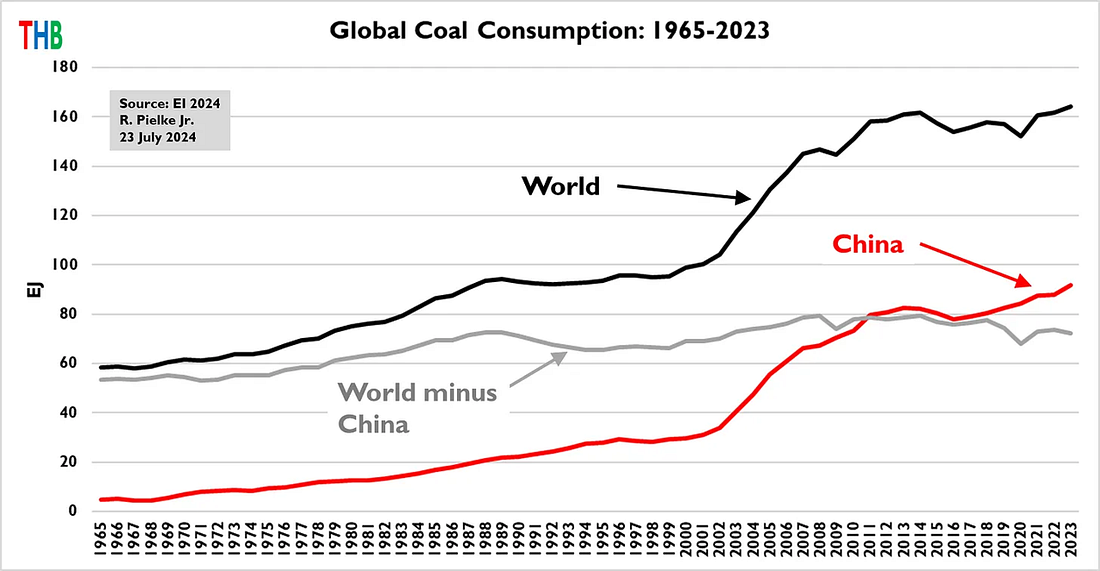
The figure above shows that minus China, global coal consumption peaked about 15 years ago and has slowly declined. In 2100, SSP3-7.0 projects >540 EJ of unmitigated coal consumption, which — were I to extend upwards the Y-axis — would sit somewhere above in the middle of the China pie chart. That is a lot of coal.
For discussion: Does the global energy mix of 2100 under SSP3-7.0 appear plausible to you?
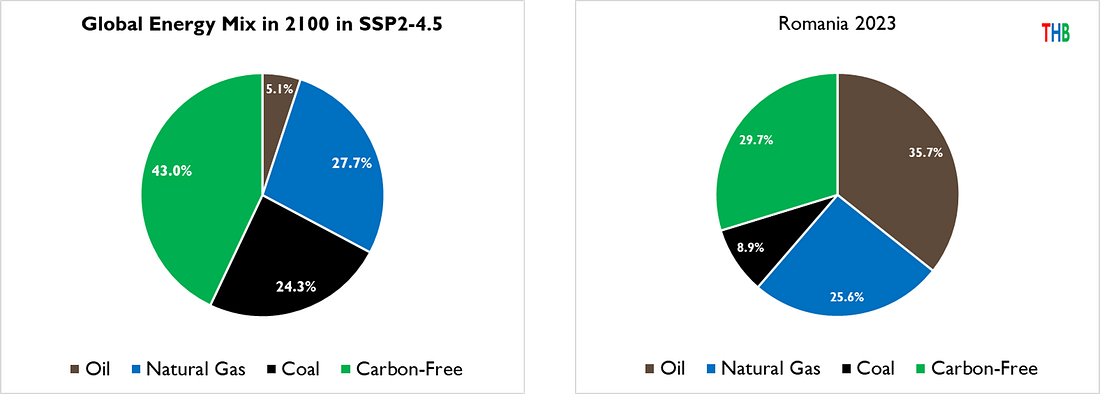
Let’s next take a look at SSP2-4.5, which is characterized as a “mitigation” scenario because it assumes continuing efforts to limit emissions. Mitigation scenarios are a bit trickier to compare because they typically assume the existence of technologies that do not yet exist, notably the large scale deployment of carbon capture and storage.
Romania in 2023 provides good energy mix comparison to SSP2-4.5 in 2100. Current global emissions are tracking below SSP2-4.5, which means that its frequent characterization as a “middle of the road” scenario is today highly misleading.
ChatGPT explains:
Romania emerges as the country whose current energy mix most closely resembles the projected 2100 global mix under SSP2-4.5, followed by Germany. These countries have a relatively even spread across coal, gas, and low-carbon sources (with neither oil nor any single fuel dominating), paralleling the balanced future mix in SSP2-4.5. These countries still differ from the projection in notable ways – especially in having higher oil shares and (in most cases) lower modern renewable shares than the 2100 target – but they are the least far from the scenario’s percentages. This comparison suggests that Romania’s 2020s energy profile is a rough real-world analog of what the world’s energy mix might look like by 2100 in a middle-of-the-road climate outcome.
A defining feature of SSP2-4.5 is a reduction in global consumption of unmitigated coal from 2020 values by almost 90%.
For discussion: Is it plausible that coal might be almost completely phased out by 2100? Are the otherwise modest changes in the global energy mix under SSP2-4.5 reasonable?
Finally, let’s take a look at SSP1-2.6, widely interpreted as a scenario consistent with the 2 degree Celsius temperature target of the Paris Agreement. Sweden in 2023 is a close analogue to SSP1-2.6 in 2100.
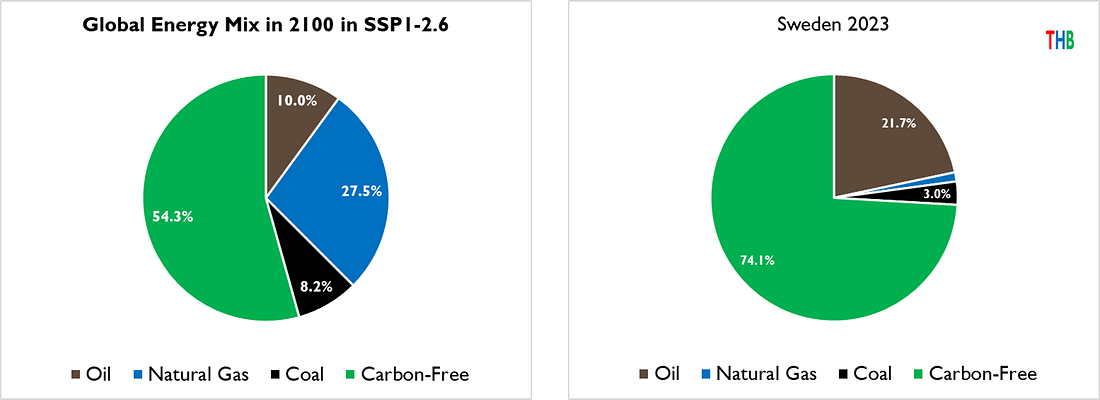 |
You can see that SSP1-2.6 has fossil fuels at ~45% of the 2100 global energy mix, but note that 90% of that consumption has emissions mitigated by carbon capture and storage, meaning that 90% of total global energy consumption in 2100 is carbon-free under SSP1-2.6.
ChatGPT explains:
While Sweden still relies on oil (~26%) more than the SSP2-2.6 scenario’s ~2%, it is the only sizeable economy today in which fossil fuels (coal + gas + oil) are already below 30% of primary energy, and where non-hydro renewables + nuclear + hydro dominate—making it the closest real-world analogue to the SSP1-2.6 2100 mix.
For discussion: Do you think it is feasible that the world might increase total energy consumption by 60% by 2100 while increasing the share of carbon-free consumption to >90%?
Some of my takeaways from this analysis:
It is utterly implausible that the global energy mix in 2100 will look like China’s in 2023, as assumed under SSP3-7.0.
Phasing out coal is the single most important step that could be taken in mitigation policy. It is not even close. International negotiations would be much more effective centered on a coal-phase out agreement, rather than on emissions, concentrations, or temperature targets.
Somewhere between Romania and Sweden, figuratively, appears to be where the world’s energy mix is headed for 2100 — based on what we know today. However, staying on a trajectory below SSP2-4.5 (Romania) will not happen automatically, but through concerted effort in pragmatic energy policies.
Scenarios assume that coal emissions will be reduced dramtically by technologies of carbon capture and storage (CCS) that do not yet exist — and may never exist. In contrast, nuclear power exists and today could readily replace most (if not all) coal consumption. Favoring coal w/ CCS over nuclear in climate scenarios reflects the values and politics of scenario creators.
This post has not considered equity in scenarios, which generally assume greater economic growth in countries that are currently rich than those that are currently poor. This is ethically improper. The world needs not only to reduce emissions, but to ensure that everyone on the planet has access to energy services that most readers of THB enjoy every day.
Next up in this series, I’ll discuss what per capita carbon dioxide emissions can tell us about plausible futures. Meantime, I welcome comments, critique, and questions!
The easiest thing you can do to support THB is to click that “♡ Like”. More likes mean that THB gets in front of more readers!
This post has been brought to you by the paid subscribers of THB, whose support makes THB possible. This was reenforced to me by the results of my recent paid subscriber poll in which 0% of paid subscribers requested more paywalled content. If you value THB and the work it brings to the public, please consider joining the paid subscribers as a THB supporter. I am appreciative — Thank you!
To be clear — there are many more factors that affect global climate beyond carbon dioxide, and global average surface temperature is not a particularly useful variable for understanding changes in climate at human and ecological scales.
Turkey’s per capita GDP in 2023 was slightly above 2023 global per capita GDP, which explains the slightly higher per capita carbon dioxide emissions. Source: World Bank.
Both ChatGPT and Claude added considerable value to my own analyses using data from the Energy Institute Statistical Review of World Energy. Each provided insights based on my questions which prompted some additional thinking and clarity on my part. Today’s post reflects my first deep dive here at THB using AI. I’m impressed.
You're currently a free subscriber to The Honest Broker. For the full experience, upgrade your subscription.
![]()
![]()