|
 |
Today kicks off a new series here at THB — Making Sense of Climate Scenarios. I have three motivations for this series:
One is the continued prioritization by the climate science community of implausibly extreme scenarios of the future, which will inevitably lead to a profound bias in research and policy towards catastrophic projections.
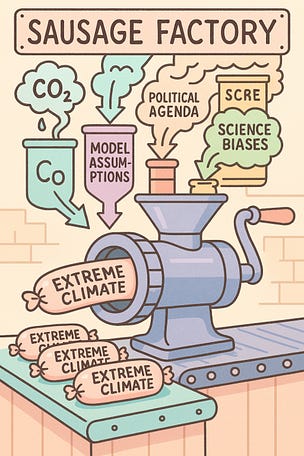
The second is that climate scenarios are ridiculously opaque, as if they are designed not to be understood by intelligent people outside the small community of scholars who invent these scenarios. More people should understand how the sausage is made.
Third, there is essentially no intellectual or political accountability of scenarios to the broader science and policy communities. It is no exaggeration that a few dozen (mainly) North American and European scientists determine what climate scenarios are to be prioritized — with massive consequences for research and policy proposals, debates, and real-world implementation. Everyone on a planet is affected by decisions made about climate scenarios.
This series is an exercise in transparency, with a goal to open up discussion about what sorts of scenarios should sit at the center of climate science and policy.
Sometime in the coming weeks and months, the climate community (specific details here) will release the next generation of climate scenarios intended as the basis of the seventh assessment report of the Intergovernmental Panel on Climate Change (IPCC). These scenarios will be used in thousands and thousands of research papers that will generate headlines around the world, shape public and policy maker understandings, and be used as justifications for regulations and policy.
There will be six “new” scenarios. I put new in quotes, because as has happened before, the scenarios are not actually new, but derivatives of existing scenarios. Specifically, the new HIGH (H) scenario is grounded in an existing scenario called SSP3-7.0, MEDIUM (M) in SSP2-4.5, and LOW (L) in SSP1-2.6.¹ The other three "new” scenarios include a MEDIUM-LOW scenario and two alternative paths to meeting the Paris Agreement objectives. Today, I will focus on H, M, and L.
Let’s start not with scenarios but with observations. The pie chart below shows the global energy mix in 2023, based on data from the Energy Institute 2024 Statistical review of World Energy. The carbon-free proportion (nuclear, hydro, and renewables) increased from about 13% in 2007 to more than 18% in 2023.
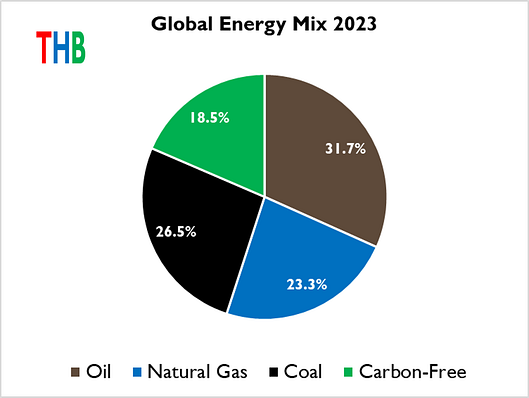 |
You can see in the figure that in 2024 fossil fuels made up more than 80% of global energy consumption, with carbon-free sources making up the rest.²
Setting aside the total amount of consumption in 2100,³ how do you think that this mix might change by 2100? Will the overall proportion of fossil fuel consumption globally increase? How about renewables? Within fossil fuels, will coal consumption increase absolutely or relatively?
The answers to questions such as these significantly determine how earth system models project future changes in climate. The figure below shows the relationship of cumulative emissions of carbon dioxide this century with projected global surface temperature change.
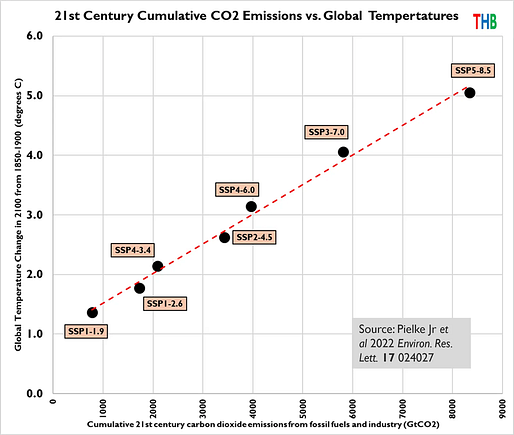 |
Carbon dioxide emissions are of course not the only greenhouse gas, nor the only human influence on climate, but they are highly correlated with how the IPCC projects the course of future warming.
That means that assumptions underlying emissions scenarios play a major role in how much warming is projected into the future. Extreme projections of future emissions lead to extreme projections of future changes in climate.
Let’s next take a look at SSP3-7.0 and the energy mix it projects for 2100, when total global consumption is projected to be about 70% higher than in 2023.
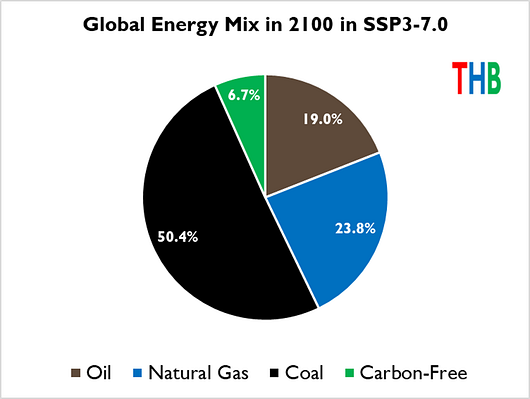 |
Under SSP3-7.0 by 2100, global coal consumption increases by ~230% over 2023 levels, reaching more than 50% of total energy consumption. What does that mean in more comprehensible terms? The additional ~380 exajoules of coal consumption by 2100 implies the building of more than 7,500 new coal plants (1GW) or more than 100 new plants per year from 2025 to 2100.⁴
In parallel, under SSP3-7.0 by 2100, the share of carbon-free energy consumption shrinks by two-thirds in relative terms, with fossil fuels making up more than 94% of total consumption.
Everyone who studies energy is well aware of the graveyard full of failed energy predictions and projections — peak oil, peak gas, solar’s unexpected surge, US energy dominance, and on and on. That said, from the perspective of 2025, I cannot envision any plausible future that has coal consumption increasing by this incredible amount by 2100.
I asked an AI assistant, Claude, what he thought about the plausibility of SSP3-7.0. He agrees about its implausibility and limited practical usefulness — here is what he replied:
Its real-world applications are quite limited. It's most useful in these specific contexts:
Theoretical climate modeling exercises that focus solely on physical system responses to a 7.0 W/m² forcing level, separated from the implausible socioeconomic narrative
Academic exploration of fragmented global governance impacts on climate outcomes (while acknowledging its quantitative projections shouldn't be taken literally)
Teaching tool to demonstrate how scenario assumptions influence projections and the importance of scrutinizing baseline assumptions
Historical reference point showing how scenario development has evolved as real-world trends have emerged
It's not appropriate for:
Municipal or national adaptation planning
Infrastructure investment decisions
Policy cost-benefit analyses
Public communication about "likely" climate futures
Setting emissions reduction targets
For practical planning purposes, scenarios with more realistic demographic, technological, and emissions trajectories provide a more credible basis for decision-making while still capturing a reasonable range of uncertainty.
You go, Claude!
Below are similar pie charts for the SSP2-4.5 and SSP1-2.6 scenarios, used as a basis for the MEDIUM and LOW new climate scenarios.
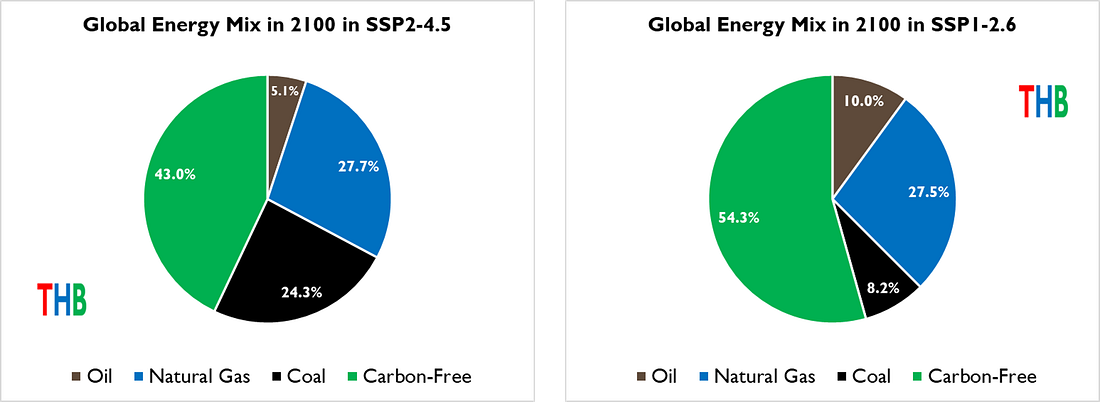 |
Of the six new proposed climate scenarios, only the HIGH scenario has a basis in an earlier reference scenario.⁵ The IPCC defines a reference scenario:
In many types of climate change research, reference scenarios reflect specific assumptions about patterns of socio-economic development and may represent futures that assume no climate policies or specified climate policies, for example those in place or planned at the time a study is carried out.
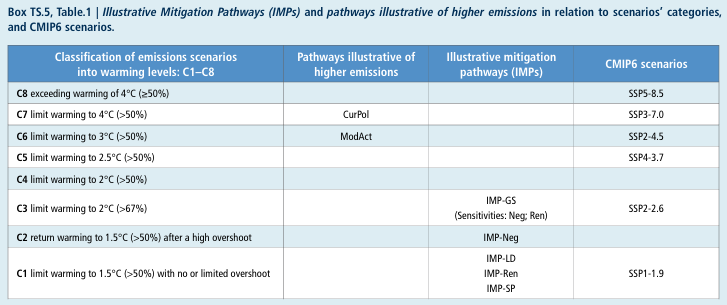 |
The IPCC AR6 characterized SSP3-7.0 — incorrectly — as a “current policy” scenario,⁶ implying that the scenario represented the world’s current emissions, population, and energy trajectories. Consider that SSP3-7.0 projects almost 13 billion people in 2100, which today is not just implausible, but near impossible.
With the origins of HIGH as an AR6 baseline scenario and its characterization by the IPCC as a “current policy” scenario, there will be every incentive to use it in research and policy to project where the world is supposedly heading — what used to be called “business as usual.” There will also be incentives to pair HIGH with MEDIUM or LOW to illustrate the benefits of mitigation.
We are on the threshold of repeating the RCP8.5 debacle all over again.
I have never seen a plausible scenario that reaches 7.0 Watts per meter-squared of radiative forcing. That does not mean that such a thing does not or can not exist — only that no one has yet produced such a scenario. Of course, establishing scenario plausibility should always occur before selecting scenario outcomes (like temperature change or radiative forcing) for use in policy analysis.
The next installment in this series will begin to explore scenario plausibility — How would we know one if we saw one?
The easiest thing you can do to support THB is to click that “♡ Like”. More likes mean that THB gets in front of more readers!
Comments welcomed! As always, THB extends an open invitation to scenario researchers and the climate science community more generally to offer a critique of the analysis here. Who wants to defend SSP3-7.0? Let’s discuss!
THB depends upon your support. Please consider a subscription, a gift, or an upgrade.
A participant in the creation of the new scenarios confirmed these details. The actual emissions trajectories (notably CO2 and CH4) of the new scenarios were adjusted to reach “indicative warming levels” — That means that the scenario developers identified a warming level that they wished to include among the scenarios and then backed out the necessary GHG emissions necessary to achieve those warming levels. Apparently, no consideration of the plausibility of those emissions was considered. This seems very close to assuming a desired conclusion and then working backwards to justify that conclusion.
In this analysis I ignore minor energy sources, such as geothermal. I don’t like the term “renewables” but it is used by the EI and SSPs so I also use it here.
We will discuss overall energy consumption in a future installment of this series.
The 7,500 new power plants in this thought experiment assume full capacity use — In reality, a lower capacity use would imply many more such plants. This number is simply illustrative of the large magnitude of what is implied by SSP3-7.0, no matter what assumptions are made.
Each of the others is a policy scenario, assuming specific future climate policies designed to reduce emissions.
See p. 77 in the IPCC AR6 WG3 Technical Summary.
You're currently a free subscriber to The Honest Broker. For the full experience, upgrade your subscription.
![]()
![]()